Data Sustainability FarmTrak Sustainability

FarmTrak Sustainability: Data and analytics for agriculture sustainability globally

Farmer holding soil embracing sustainability
FarmTrak Sustainability dashboard in computer.png

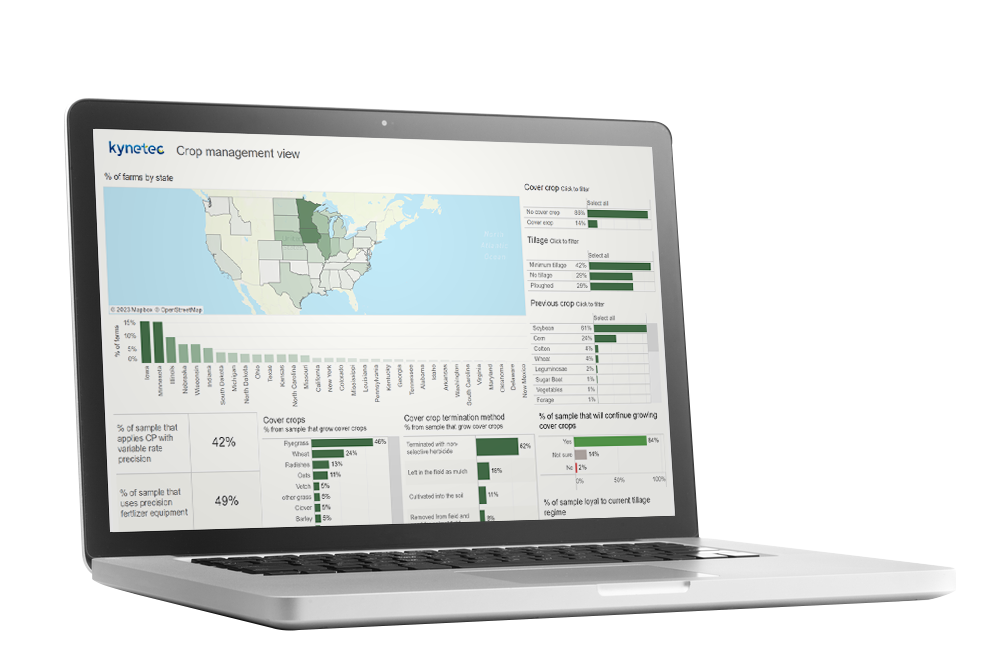
Monitoring and reporting of all major commodities, at scale

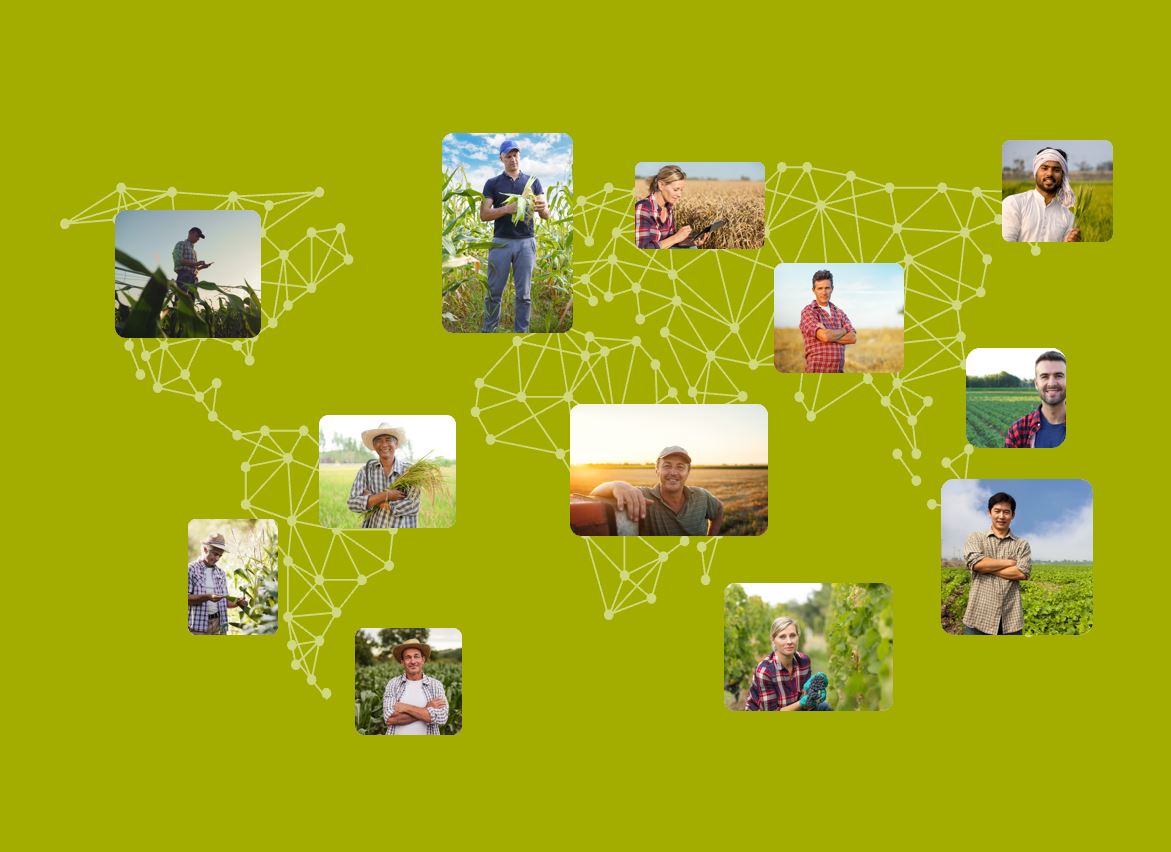
FarmTrak Sustainability provides the data and insights needed to understand how 570 million farmers impact climate, water and biodiversity.

Farmers FarmTrak Sustainability

Annually updated primary data, combining earth observation with representative samples of crop and livestock farmers in over 50 countries


FarmTrak Sustainability enables players across the agribusiness chain to access for the first-time primary data, collected directly from farmers. 

The data from FarmTrak Sustainability replaces:

  • Out of date, inaccurate, incomplete inconsistent secondary data
  • Data dependent on earth observation alone
  • Self-complete platforms, that place the burden on farmers entering data themselves
  • Unrepresentative data from supply chains, where data is inherently biased due to it not being random
FarmTrak - connecting with farmers globally

Supporting agribusiness to help farmers farm more sustainably

FarmTrak Sustainability enables agribusinesses to identify on which types of farms and geographies to focus sustainability initiatives, measure if interventions are making a difference and calculate how much benefit can be claimed in ESG reporting.

Solving problems and creating opportunities

Combining primary on-farm data with advanced analytics of earth observation and other data sources, and the APIs of a range of environmental impact models, FarmTrak Sustainability provides the data and insights needed to measure and track improvements in carbon emissions, biodiversity impact, water use and water quality in the most significant agricultural sectors.

Summarized in three use cases:
  • Scope 3/ESG reporting
  • Sourcing footprints
  • Measure and Report, the "MR" of "MRV"
How am I doing on my path to low impact?

Three-year rolling average ESG reporting for all major commodities for each nation.

Which farm types and geographies should I focus on?

Baseline farming activities and environmental impact of individual fields and sourcing regions in order to determine additionality opportunities (use of carbon products/ interventions).

Are my interventions making a difference?

Intervention market penetration, speed of market uptake, market potential and comparisons (trends) between years, between commodities, and between geographies (country, state, zip code, sourcing regions).  

How much benefit should I claim in my ESG reporting?

Return on investment for each intervention deployed, compared against local baselines and between years. Measure the CO2e of off-setting and in-setting outside and inside your supply-chains respectively.

Request Demo

Request a demo to learn more about FarmTrak Sustainability.

Let's connect

Your business - Your decisions - What are your challenges?